Reports - Extending
WideQuick comes with a set of default report templates, but it is also possible to create fully custom templates tailored to specific needs. This section covers the complete process of creating a custom report template and its corresponding ReportController view, from designing the Excel layout to wiring it up with live data from the database.
This section assumes familiarity with the basics of the report system. If needed, see Get started and Configuring.
Creating templates
Creating a custom report template takes three steps:
- Design the template in Excel
- Configure the data sheet, macros and loggers
- Wiring it up
Designing the template
The first step is to design the report template in Excel. This includes deciding the layout, what graphs to include, and how data should be presented. WideQuick places no restrictions on the design, so the template can be tailored freely.
A report template typically consists of three sheets:
- Presentation sheet: the visible part of the report. Contains graphs, tables, and any other visual elements the report should display.
- Data sheet: a hidden sheet containing the raw data pulled from the database. This sheet feeds the presentation sheet with data. The data sheet is easier to configure in WideQuick® Designer, where hidden sheets are visible, rather than directly in Excel.
- Meta sheet: a hidden sheet containing general information about the report, such as the report title, current date and time, selected logger, and selected signals. This sheet is useful for displaying report metadata on the presentation sheet.
Getting started
A good starting point is to sketch out what the final report should look like before opening Excel. Knowing what data is needed and how it should be presented makes configuring the data sheet and macros much easier.
To add a new sheet to the template, open the template in WideQuick® Designer and navigate to the bottom of the sheet tabs. Click Create New Sheet, see image below. To hide the sheet, right-click the sheet tab and select Hide Sheet.

Note
Hidden sheets are only visible in WideQuick® Designer and will not be visible in the final generated report or when opening the template directly in Excel. Try generating a report with the sheet visible once the macro command is set, to get a feel for how the data is oriented.
Configuring the data sheet, macros and loggers
The data sheet is a hidden sheet within the report template that acts as a container for the raw data pulled from the database. When a report is generated, WideQuick uses macro commands placed in the data sheet to query the database and populate it with data.
To add a macro command, right-click a cell in the data sheet and select Edit Expression. This will open the following popup:
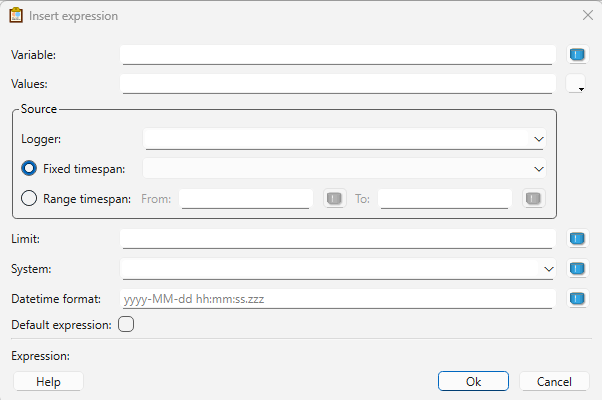
Below is a description of each field:
-
Variable — Defines which signal to query. Two options are available:
variable_ref[#]— Queries a specific signal, where#is the index of the signal. A separate macro call is required for each signal.alarms— A wildcard that pulls all alarms in the selected logger.
-
Values — Defines which data columns to include. Depends on the type of data being queried:
- Signal data:
name,datetime,valueis typically sufficient. - Alarm data:
name,state,severity,timestamp,text,group. Include only the fields needed for the report.
- Signal data:
-
Logger — The logger the report queries data from. This must be set statically and cannot be changed dynamically.
- Fixed/Range timespan — The reporter uses Range timespan by default, with
Report_Reference.from_timeandReport_Reference.to_timeas the start and end times. These are set by the time objects in the ReportController. - Limit — The maximum number of rows to populate. This is set by the user in the ReportController when generating the report.
- Datetime format — The format used for datetime values. Defaults to
yyyy-MM-dd hh:mm:ssbut can be adjusted to fit the needs of the report.
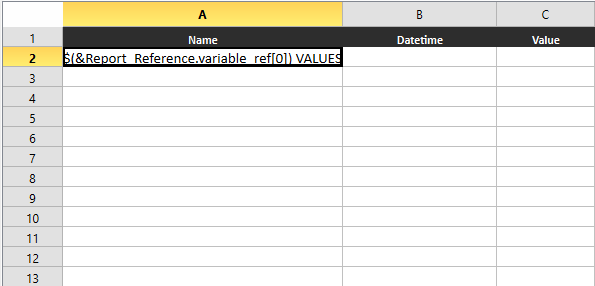
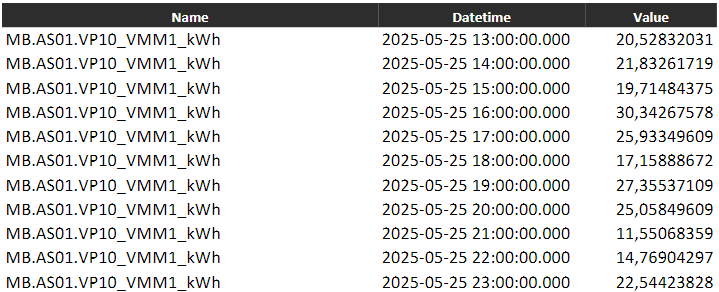
The placement of the macro command is important. Data is populated starting from the cell the macro is placed in and expands downward. The columns are determined by the
Values field. For example, a signal macro with VALUES(name, datetime, value) will
populate three columns starting from the macro cell:
And for alarm data with VALUES(name, state, severity, timestamp, text, group):
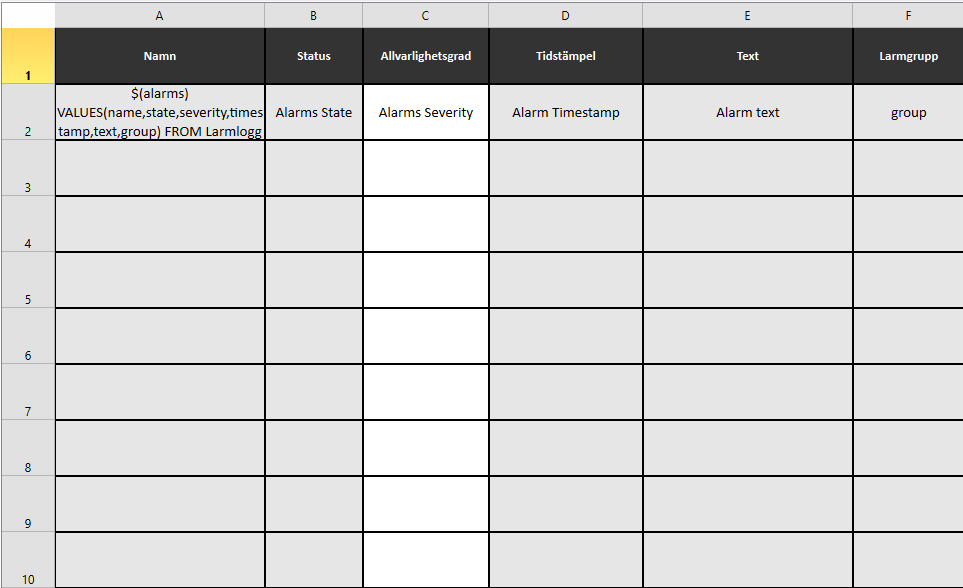
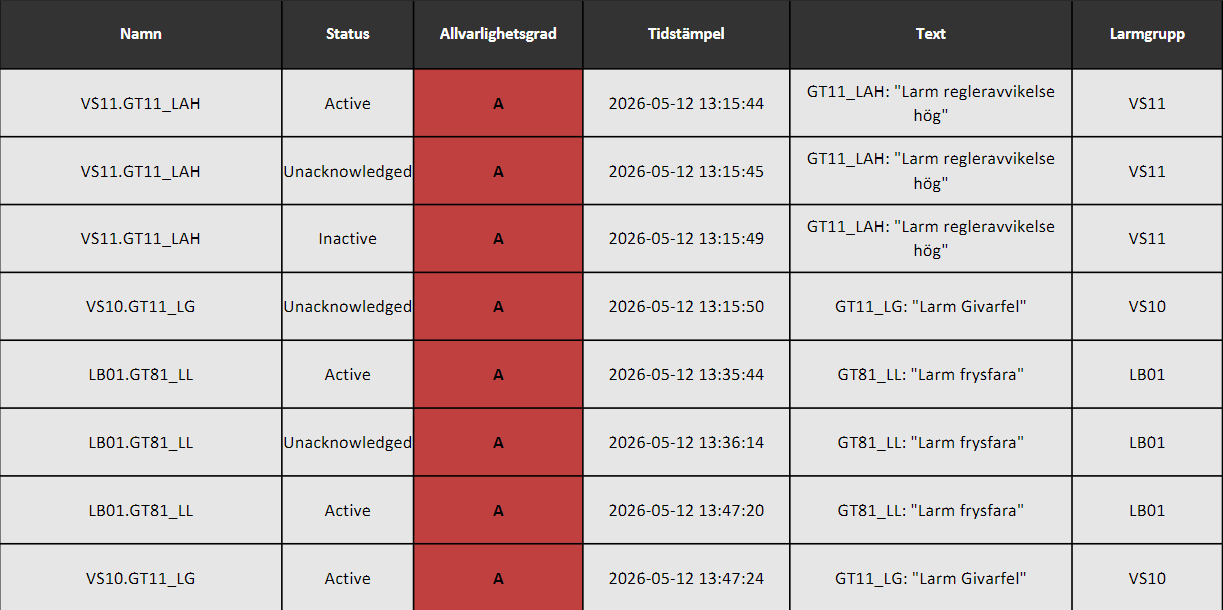
The number of rows populated depends on the Limit and timespan, which are set by the user in the ReportController when generating the report.
Meta sheet
The Meta sheet is a useful place to store general report information that is not
pulled from the logger. It uses $() expressions to print internal or system
variables directly into cells. For example:
$(Report_Reference.title)— The report title set by the user.$(Report_Reference.logger)— The logger used for the report.$(Report_Reference.from_time)— The start time of the report.$(Report_Reference.to_time)— The end time of the report.$(Report_Reference.limit)— The maximum number of events.$(Report_Reference.variable_ref[#])— The signal at index#.$(Report_Reference.unit)— The unit for the report.$(Report_Reference.factorArray[#])— The scaling factor for each signal at index#.$(System.dateTime)— The current date and time.$(System.user)— The current user.
The Meta sheet is the only way to pass the report title set by the user into the presentation sheet. The integrator is free to include whichever fields are relevant to their report.
Wiring it up
With the presentation sheet designed and the data sheet populated with macro commands, the final step is to connect the two by linking the raw data to the graphs, tables, and other visual elements in the presentation sheet.
A few tips for wiring up the template effectively:
- Use the data sheet for calculations: since the data sheet is hidden in the final report, it is a good place to perform intermediate calculations before passing the results to the presentation sheet. To edit it in Excel, temporarily unhide it.
- Keep calculations away from the macro data: since macro data expands downward row by row, place any additional calculations in columns further to the right to avoid conflicts.
- Reference the data sheet from the presentation sheet: graphs, bars, and other visual elements in the presentation sheet should reference cells in the data sheet rather than containing logic themselves. This keeps the presentation sheet clean and easier to maintain.
- Use fixed ranges that cover the maximum possible rows: since the amount of data
varies depending on the Limit and timespan, define ranges that cover the maximum number of rows the report could produce. Use
IFERRORto handle empty cells gracefully.
Note
This guide does not cover Excel formula design in depth, since the possibilities are largely up to the integrator. The tips above are specific to working with WideQuick macro data.
Creating the ReportController view
With the template created, the next step is to build the ReportController view. This view determines which signals and data are sent to the report when it is generated. The system links a ReportController to a report template by matching their names, so it is important that the view is named exactly the same as the report template.
To get started, navigate to Templates in the project tree and duplicate the Template_ReportController view. Move the duplicate to the ReportController folder and rename it to match the report template name.
When a ReportController view is loaded, its template script initializes a view.data
object with default values such as report type, time span, logger, and signal references.
Each object placed in the view, such as to_time, Report_CustomTitle and LoggerList, reads from and writes to this shared view.data object as the user
interacts with them.
When Button_CreateReport object is clicked, it collects the complete view.data
object and adds it to a report queue via scReports.addReportToQueue() function.
Reports in the queue are processed one at a time. The scReports script populates a
global Report_Reference object with the queued data, which the macro commands in
the data sheet read from when querying the database.
The correct template is identified and triggered using the report_type field in
view.data, which is derived directly from the ReportController view name. This is why
it is critical that the ReportController view name exactly matches the report template name. If they differ, the scReports script cannot locate and trigger the correct template.
Naming convention
The ReportController view name must exactly match the report template name. If they
differ, scReports script will not be able to locate and trigger the correct template.
To build the view, a set of premade objects is available in the object library under Report. Below is a description of each object and when to use it:
| Object | Use when |
|---|---|
LoggerList |
The user selects signals from a logger |
LarmLogger_List |
The user selects alarms from an alarm logger |
Unit |
The user selects a unit and prefix for the report |
Report_CustomTitle |
The user sets a custom report title |
Button_CreateReport |
Always. It is required to generate the report |
Report_output_type |
The user chooses between PDF and Excel output |
to_time |
The user sets an end time |
from_time |
The user sets a start time |
to_time_Singel |
The report uses a fixed time span (e.g. last 3 years) |
Numbe_of_event |
The number of collected events should be limited |
LoggerList
The LoggerList object is a TreeView configured to display the signals logged by a
specific logger. When a signal is selected, a green checkmark appears next to it in the
TreeView. The object also includes two text boxes showing the currently selected logger
and the number of signals selected out of the maximum allowed.
The logger to display and the maximum number of selectable signals are both configured as properties on the object. Assign the desired values when placing the object in a ReportController.
LarmLogger_List
The LarmLogger_List object is a specialized version of LoggerList, purpose-built
for displaying alarms logged by a logger. Unlike LoggerList, it automatically builds
its tree based on alarm groups and omits redundant information. For example, if all
alarms in the logger follow the pattern AS01.AS01_XXX_XX, the TreeView will display
them simply as XXX_XX.
This object has two properties that must be configured:
- Logger — Determines which logger the TreeView is built from. This should always match the logger that the report queries.
- Signals — Controls how many signals can be selected for the report. The default maximum is 15, and it can be changed. See Changing the maximum of signals to be selected. This property should always be set to a numerical value, unless the TreeView is intentionally locked.
Unit
The Unit object holds the two pickers that decide the report's display unit: a Unit
combo box for the base unit and a Prefix combo box for the SI prefix. The two are
combined when the report is created, so k and Wh give kWh.
The Unit list is not a fixed set. It is built at runtime from the units of the signals on the logger the signal list is bound to, reduced to their SI base, so only units the project actually logs are offered. A signal whose unit is not recognised is left out of the list. See Adding a base unit for the recognised set and how to extend it.
Placing the object also turns on unit filtering for the signal list:
- The signal TreeView stays disabled until a unit is chosen.
- Choosing a unit filters the TreeView to signals of that dimension.
- Changing the unit clears the current selection, since the signals selected under the previous unit are no longer in the list.
Filtering is therefore opt-in per ReportController. A controller built without the Unit
object leaves the TreeView unfiltered, allows signals of different dimensions in the same
report, and sends every value in its own native unit with no scaling applied. The alarm
report controllers are built this way.
The object takes no properties. It locates the signal list on its own, so the same object works whether the view holds one logger list or shows a second one in its place.
Report_CustomTitle
The Report_CustomTitle object consists of a label and a text box. The text box sets
the title of the report and is configured to communicate with the active data on the
view.
Button_CreateReport
The Button_CreateReport object is a button that triggers report generation. When
clicked, it gathers data from the view and sends it to the scReports script to create
the report.
Report_output_type
The Report_output_type object consists of a label and a ComboBox. The selected
ComboBox value determines whether the report is generated as a PDF only, or as both a
PDF and an Excel file.
to_time
The to_time object consists of a label and a DateTime editor. The DateTime editor
sets the end time of the report and is configured to report its current value to the
view.
from_time
The from_time object works the same way as the to_time object, but sets the start
time of the report instead.
to_time_Singel
The to_time_Singel object combines the functionality of to_time and from_time
into a single object. It is used when the report template requires a fixed time span.
The following properties can be configured:
- Years prior — Sets the time span in years.
- Weeks prior — Sets the time span in weeks.
These two properties are mutually exclusive: weeks and years cannot be combined.
Numbe_of_event
The Numbe_of_event object consists of a label and a SpinBox. The SpinBox value
determines how many events are collected per macro call. This distinction is important:
- If the
alarmswildcard is used, the value represents the total number of events. - If
variable_ref[#]is used, the value represents the number of events per signal.
Changing the maximum of signals to be selected
In the default reporter settings 15 signals are allowed to be selected for report generations. This can easily be changed if more signals are required. First, in WideQuick® Designer navigate to Data Types → Arrays → variable_ref and select Properties.... This will bring up the following popup:
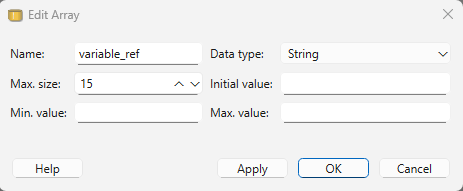
Change the Max. size to the desired value. Click Apply then Ok. The Report_Reference array has now been updated.
Next, update the scReports script to handle the new size. Locate the
createReport() function and change the value 15 to the new Max. size value:
for (var i = 0; i < 15; i++) Report_Reference.variable_ref[i] = "";
var signals = reportObj.variable_ref.split(',');
for (var i = 0; i < signals.length && i < 15; i++) Report_Reference.variable_ref[i] = signals[i];
for (var i = 0; i < YOUR_MAX_VALUE; i++) Report_Reference.variable_ref[i] = "";
var signals = reportObj.variable_ref.split(',');
for (var i = 0; i < signals.length && i < YOUR_MAX_VALUE; i++) Report_Reference.variable_ref[i] = signals[i];
Adding a base unit
The report system recognises six physical quantities, each in any SI prefix:
| Base unit | Dimension power |
|---|---|
W |
1 |
Wh |
1 |
m³ |
3 |
m³/h |
1 |
L |
1 |
L/s |
1 |
The prefixes offered are T, G, M, k, h, da, none, d, c, m, µ, n and
p, so the six bases cover 78 unit strings between them.
The dimension power is what keeps the scaling correct. A prefix on a linear quantity scales
by the prefix itself, so dW is a tenth of W. A prefix on m³ applies to the metre
before it is cubed, so dm³ is a thousandth of m³ rather than a tenth. Any base that is
a length cubed takes power 3, everything else takes 1.
Adding a base unit is a change in two places in the scReports script, and the two must be
kept in step.
First, add the unit to the baseUnitInfo table together with its dimension power:
this.baseUnitInfo = {
    "W": { power: 1 }, "Wh": { power: 1 },
    "m³": { power: 3 }, "m³/h": { power: 1 },
    "L": { power: 1 }, "L/s": { power: 1 }
};
this.baseUnitInfo = {
    "W": { power: 1 }, "Wh": { power: 1 },
    "m³": { power: 3 }, "m³/h": { power: 1 }, "m³/s": { power: 1 },
    "L": { power: 1 }, "L/s": { power: 1 }
};
Then add the same string to baseUnitOrder. That list is ordered longest first so a
compound unit is matched whole instead of being read as a prefix followed by a shorter base.
m³/h has to be tested before m³, or it would be read as prefix m plus base ³/h.
Place a new unit ahead of any shorter unit it begins with:
this.baseUnitOrder = ["m³/h", "m³/s", "L/s", "m³", "Wh", "W", "L"];
Why the order is a separate list
baseUnitOrder could be derived from the keys of baseUnitInfo at runtime, but this
engine throws "Function call requires Object type" when Array.sort() is given a
comparator function. The order is kept as a static list instead.
Units where a prefix has no meaning
The prefix pickers apply to every base in the table. A unit that cannot sensibly take a
prefix, such as °C, would still be offered with the full prefix list, and k°C is not
a meaningful reading. Only add units where SI prefixes carry a meaning.
A signal whose unit is not in the table is skipped without a log entry when the Unit list is built. A logger holding only unrecognised units therefore produces an empty Unit list, and because the signal TreeView is gated on a unit being chosen, the controller appears to offer no selectable signals at all. Adding the unit to the table resolves it.