Dashboards - Configuring
Parameters
All widgets share a Header parameter, a string, that sets the title displayed on the widget. If left empty the widgets has a standard header.
Parameters that accept multiple signals or groups accept either a single string or an array of strings.
Some widgets include an expand button in the top-right corner. Clicking it opens a fullscreen version of the widget for a more detailed view.
Widgets that display a signal legend automatically handle overflow. When there are more signals than fit in the legend, a button shows how many are hidden. Clicking it opens the fullscreen view with all signals listed.
Widgets
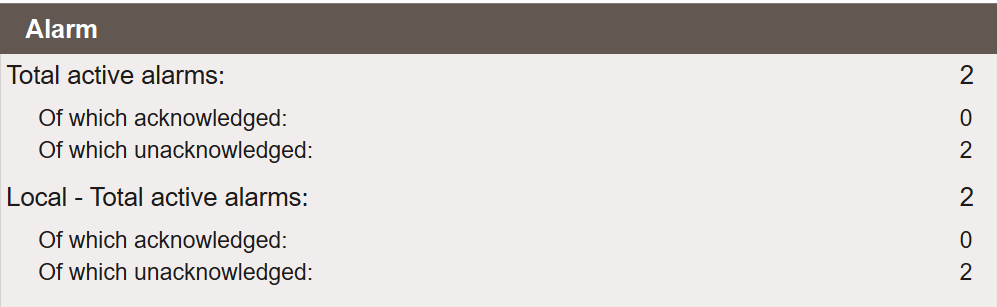
Alarm Status
Displays alarm counts: total, acknowledged and unacknowledged.
Parameters
Grupp— Filter alarms by group name. Leave empty to show all alarms.
Alarm Row
A compact single-row alarm indicator. Intended to sit at the top or bottom of a dashboard as a thin status band.

Parameters
Grupper— Filter alarms by group name. Leave empty to show all alarms.
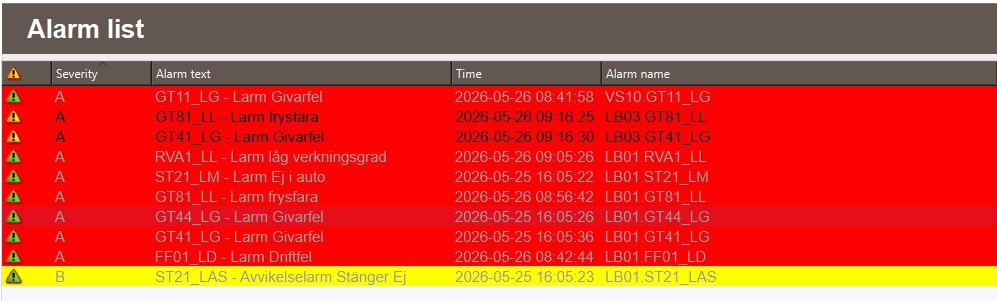
Alarm List
Displays currently active alarms in a scrollable list.
Parameters
Grupper— Filter alarms by group name. Leave empty to show all alarms.
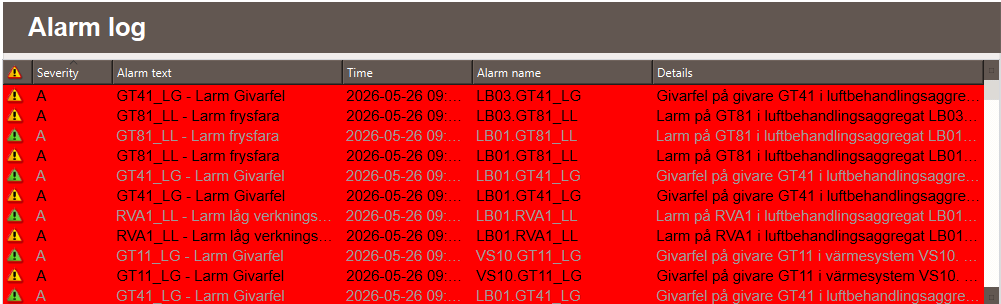
Alarm Log
Displays historical alarms in a scrollable list.
Parameters
Grupper— Filter alarms by group name. Leave empty to show all alarms.
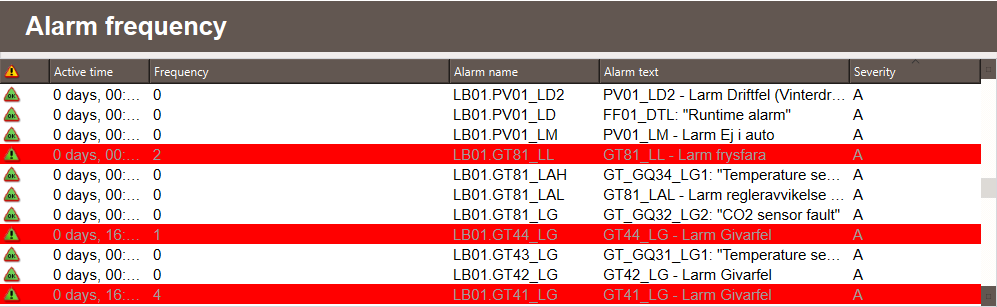
Alarm Frequency
Displays how often alarms have been triggered.
Parameters
Grupper— Filter alarms by group name. Leave empty to show all alarms.
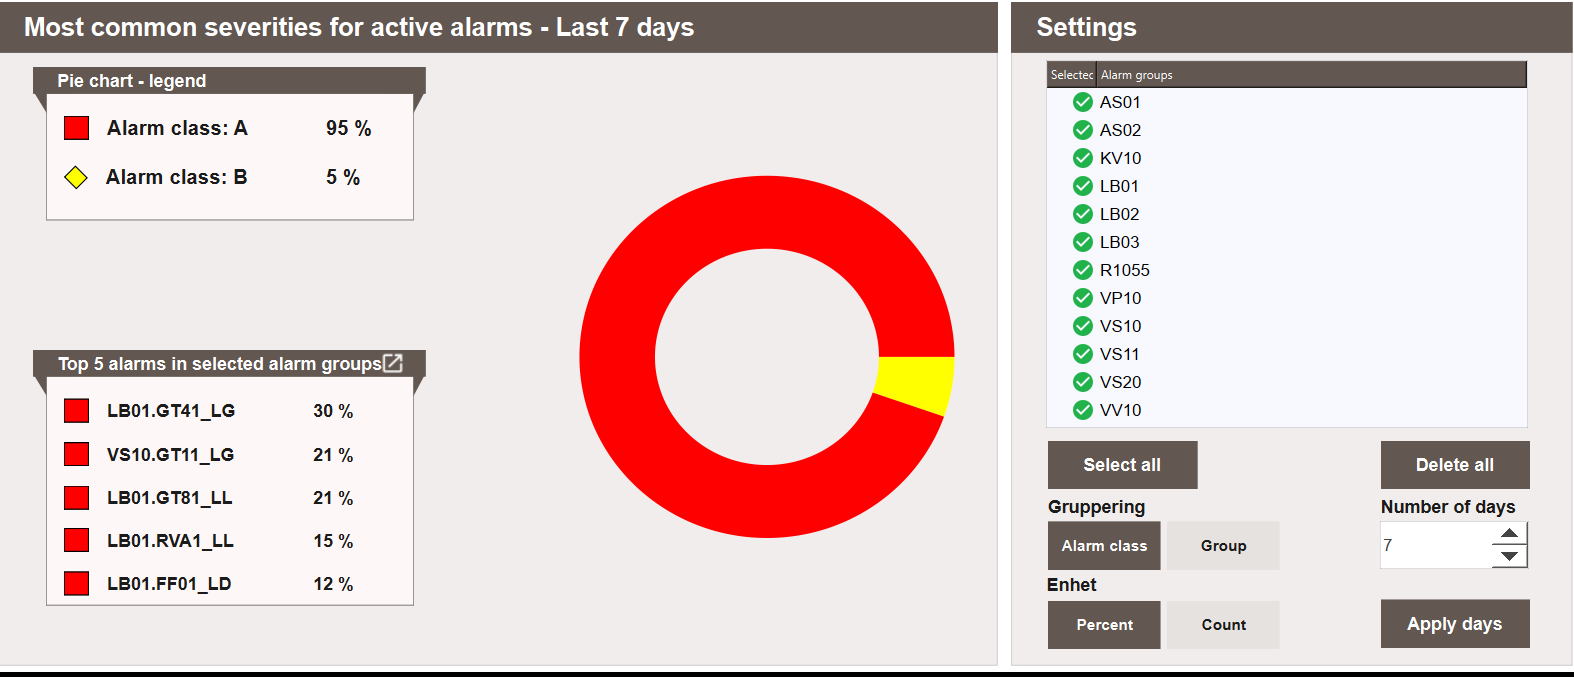
Alarm Graph
A larger alarm trend and distribution graph. Suited for dashboards where alarm analysis is a primary focus.
History
Displays historical signal values as a trend graph. The legend shows current values with units and decimal precision.
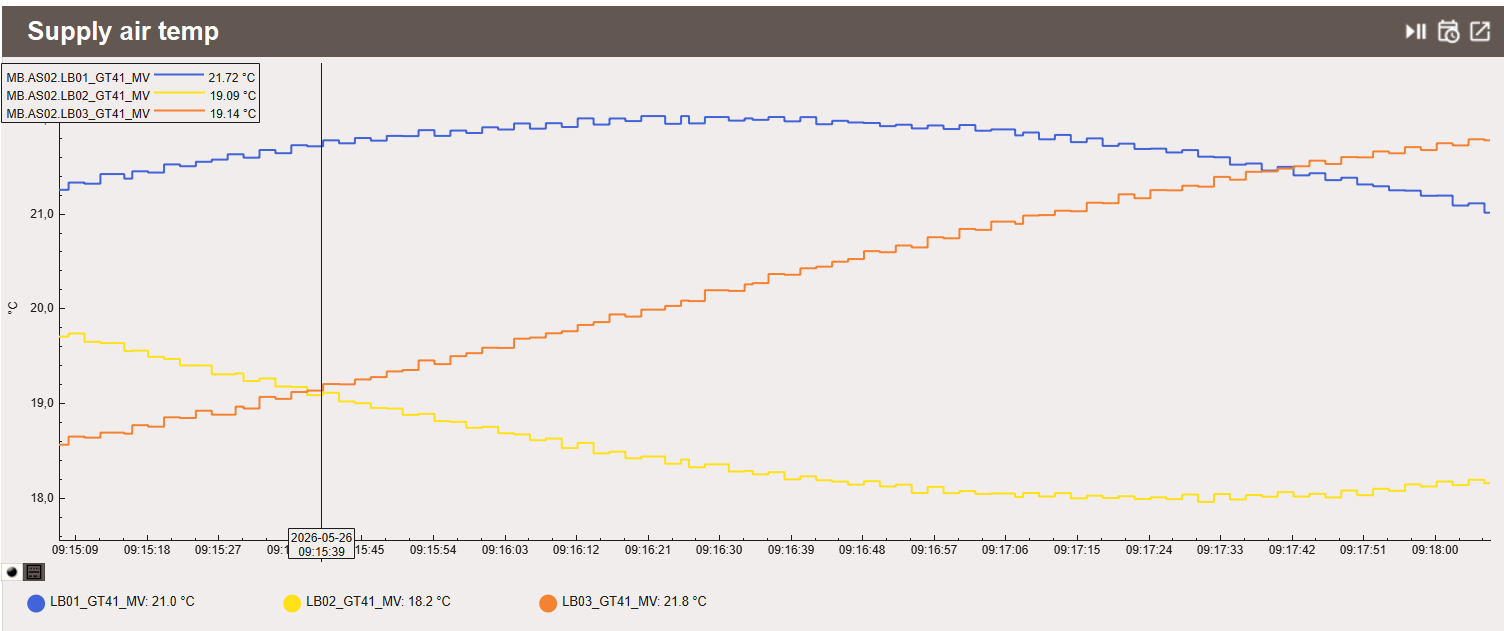
The From and To fields at the top of the dashboard set the time range. How that range is applied depends on which button is used:
- Apply — applies the From/To range to all History widget instances on the dashboard.
- Calendar icon (on an individual widget) — applies the From/To range to that widget instance only, without affecting the others.
- Reset — sets all History widget instances back to the default 5-minute window.
Parameters
Signaler— Signal path or array of signal paths to display.
Key Value
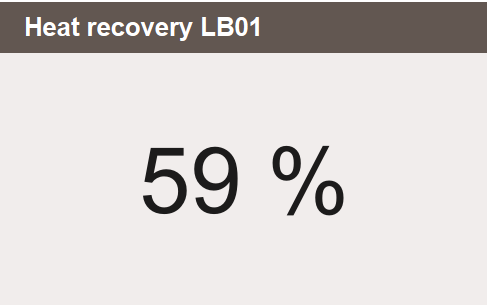
Displays a single live value with its configured unit and decimal precision. Accepts any value in Data Store: internal variables, driver signals and System variables.
Parameters
KeyValue— Direct variable reference (not a string). Enter the variable path without quotes:MB.AS01.LB01_P, not"MB.AS01.LB01_P".
Signal Value Display
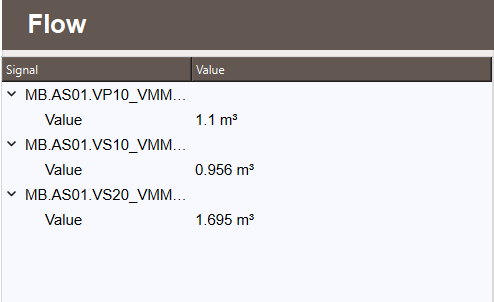
Displays current live values for one or more signals. Automatically resolves units and decimal precision from Data Store.
Parameters
Signaler— Signal path or array of signal paths to display.
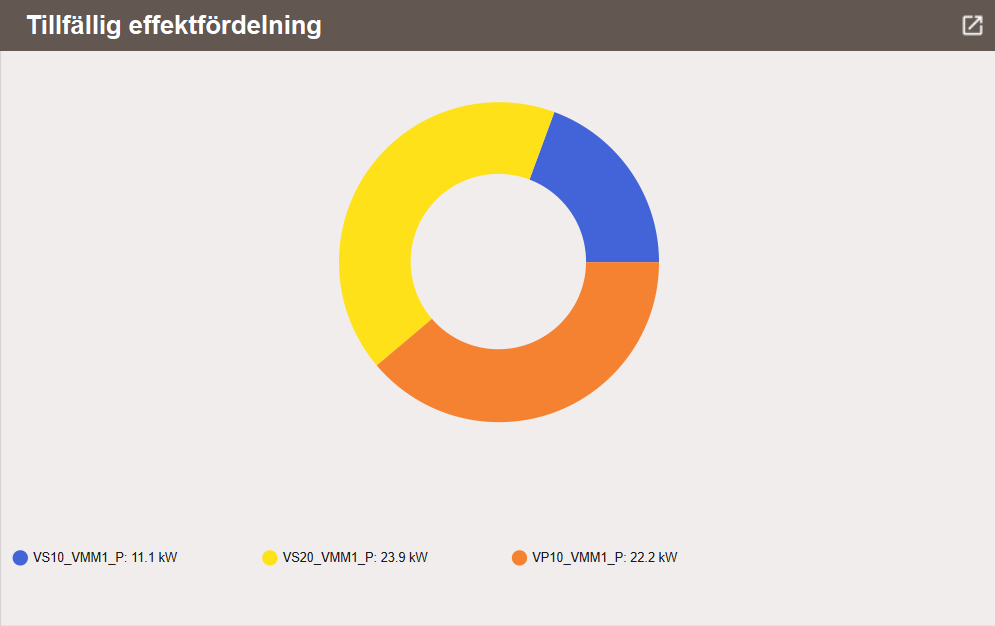
Pie Chart
Displays real-time signal distribution as a pie chart. Includes an expand button that opens a fullscreen view.
Parameters
Signaler— Array of signal paths to display.
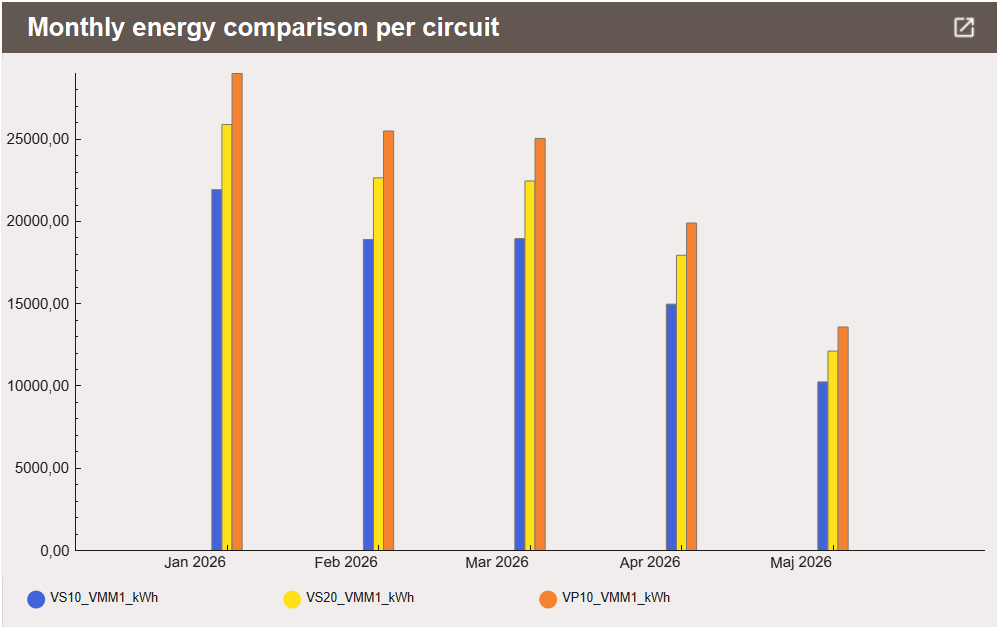
Bar Chart
Displays signal value comparisons as a bar chart across configurable time periods. Suited for energy comparisons over time. Includes an expand button that opens a fullscreen view.
Parameters
Signaler— Array of signal paths to display.Typ— Aggregation mode. Determines how each period's bar value is calculated. Defaults toAdd.TimePeriod— The time unit for each bar:"Day","Week","Month"or"Year". Defaults to"Month".TimeSpan— Number of periods to display. Defaults to12.LeftOrder— Direction of the date axis. Set to1to place older values to the right. Left empty, older values are placed to the left.
Typ |
Description |
|---|---|
Add |
Sums all logged values within each period. Use for instantaneous signals such as power, where the sum represents total energy consumed. |
Average |
Calculates the average of all logged values within each period. Use for continuous signals such as temperature. |
Trend |
Shows the difference between the last value in the current period and the last value in the previous period. Use for signals where the change from one period to the next is what matters. |
Result |
Shows the last logged value within each period. Use for signals where the end-of-period state is what matters. |
Gauge
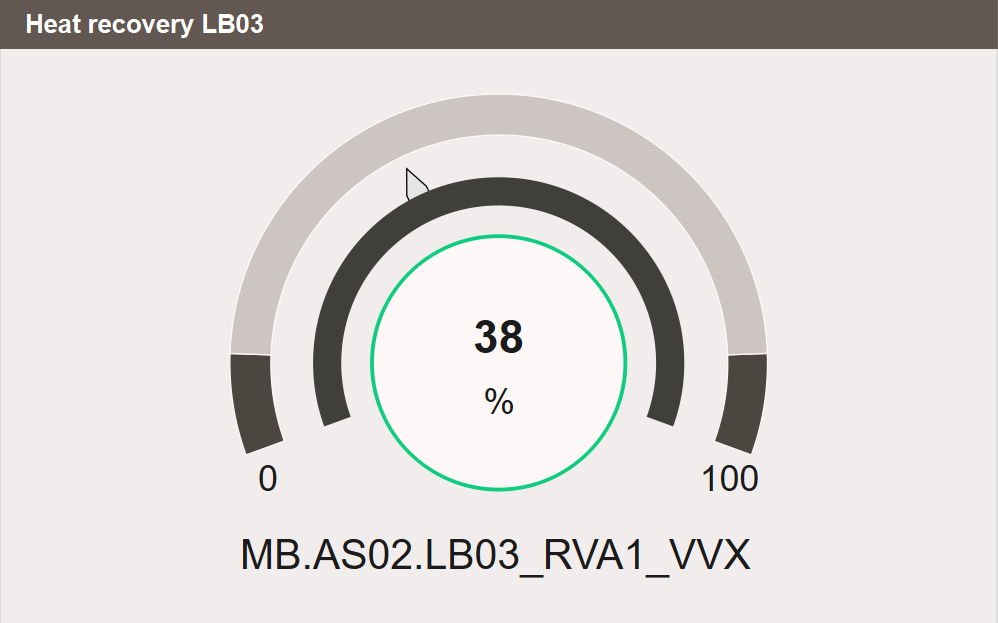
Displays a single live value as a dial against a configured range, with an optional warning band. The value is shown in the centre with its unit, the range ends are labelled at each side, and the signal path is shown below. Two sizes are available: Gauge_1x1 occupies a single grid cell and Gauge_2x2 a two-by-two block.
Parameters
Signal— The signal path to display.Name— The label shown for the value.Header— The widget heading.MinandMax— The ends of the dial's range.WarningMinandWarningMax— The bounds of the warning band drawn on the dial.
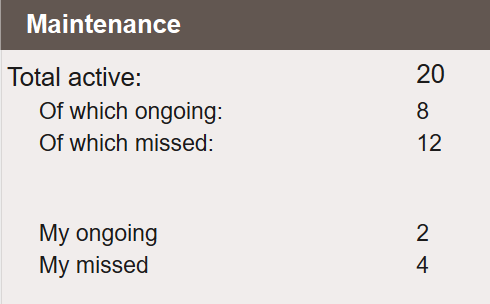
Maintenance
Displays maintenance task status: active, planned and missed tasks. Connects directly to the maintenance module. No signal input required.
Next Steps
- Extending — custom widgets, design patterns and troubleshooting